|
|
为什么要做日志分析平台?
随着业务量的增长,每天业务服务器将会产生上亿条的日志,单个日志文件达几个GB,这时我们发现用Linux自带工具,cat grep awk 分析越来越力不从心了,而且除了服务器日志,还有程序报错日志,分布在不同的服务器,查阅繁琐。
待解决的痛点:
1、大量不同种类的日志成为了运维人员的负担,不方便管理;
2、单个日志文件巨大,无法使用常用的文本工具分析,检索困难;
3、日志分布在多台不同的服务器上,业务一旦出现故障,需要一台台查看日志。
为了解决以上困扰:
接下来我们要一步步构建这个日志分析平台,架构图如下:
[url=s5.51cto.com/wyfs02/M00/88/A0/wKioL1f93pWDzh14AAFeY_uvtXc440.png]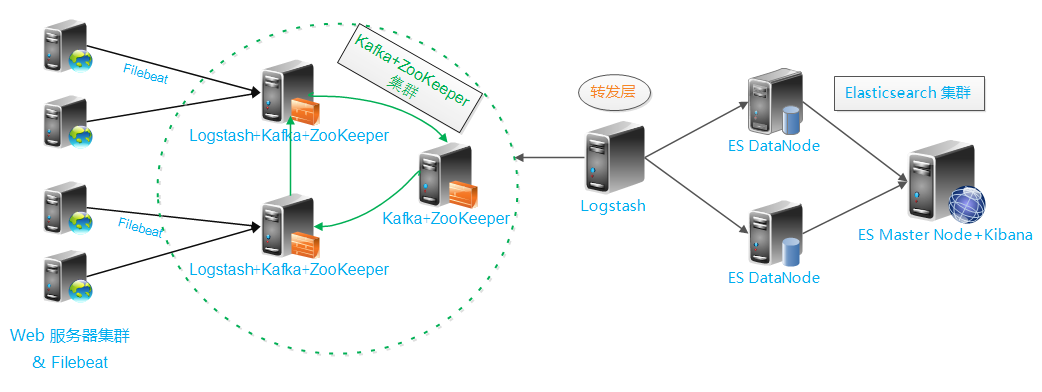 [/url] [/url]
架构解读 : (整个架构从左到右,总共分为5层)
第一层、数据采集层
最左边的是业务服务器集群,上面安装了filebeat做日志采集,同时把采集的日志分别发送给两个logstash服务。
第二层、数据处理层,数据缓存层
logstash服务把接受到的日志经过格式处理,转存到本地的kafka broker+zookeeper 集群中。
第三层、数据转发层
这个单独的Logstash节点会实时去kafka broker集群拉数据,转发至ES DataNode。
第四层、数据持久化存储
ES DataNode 会把收到的数据,写磁盘,建索引库。
第五层、数据检索,数据展示
ES Master + Kibana 主要 协调ES集群,处理数据检索请求,数据展示。
笔者为了节约宝贵的服务器资源,把一些可拆分的服务合并在同一台主机。大家可以根据自己的实际业务环境自由拆分,延伸架构。
开 工 !
操作系统环境 : CentOS release 6.5
各服务器角色分配 :
| IP | 角色 | 所属集群 | | 10.10.1.2 | 业务服务器+filebeat | 业务服务器集群 | | 10.10.1.30 | Logstash+Kafka+ZooKeeper |
Kafka Broker 集群
| | 10.10.1.31 | Logstash+Kafka+ZooKeeper | | 10.10.1.32 | Kafka+ZooKeeper | | 10.10.1.50 | Logstash | 数据转发 | | 10.10.1.60 | ES DataNode |
Elasticsearch 集群
| | 10.10.1.90 | ES DataNode | | 10.10.1.244 | ES Master+Kibana |
软件包版本:
jdk-8u101-linux-x64.rpm
logstash-2.3.2.tar.gz
filebeat-1.2.3-x86_64.rpm
kafka_2.11-0.10.0.1.tgz
zookeeper-3.4.9.tar.gz
elasticsearch-2.3.4.rpm
kibana-4.5.3-linux-x64.tar.gz
一、安装部署Elasticsearch集群
布置ES Master节点 10.10.1.244
1、安装jdk1.8,elasticsearch-2.3.4
oracle官网 jdk 下载地址: http://www.oracle.com/technetwork/java/javase/downloads/index.html
elasticsearch 官网: https://www.elastic.co/
# 安装命令
yum install jdk-8u101-linux-x64.rpm elasticsearch-2.3.4.rpm -y
# ES 会被默认安装在 /usr/share/elasticsearch/
2、系统调优,JVM调优
# 配置系统最大打开文件描述符数
vim /etc/sysctl.conf
fs.file-max=65535
# 配置进程最大打开文件描述符
vim /etc/security/limits.conf
# End of file
* soft nofile 65535
* hard nofile 65535
# 配置 JVM内存
vim /etc/sysconfig/elasticsearch
ES_HEAP_SIZE=4g
# 这台机器的可用内存为8G
3、编写ES Master节点配置文件
# /etc/elasticsearch/elasticsearch.yml
# ---------------------------------- Cluster -----------------------------------
# Use a descriptive name for your cluster:
cluster.name: bigdata
# ------------------------------------ Node ------------------------------------
node.name: server1
node.master: true
node.data: false
# ----------------------------------- Index ------------------------------------
index.number_of_shards: 5
index.number_of_replicas: 0
index.refresh_interval: 120s
# ----------------------------------- Paths ------------------------------------
path.data: /home/elk/data
path.logs: /var/log/elasticsearch/elasticsearch.log
# ----------------------------------- Memory -----------------------------------
bootstrap.mlockall: true
indices.fielddata.cache.size: 50mb
#------------------------------------ Network And HTTP --------------------------
network.host: 0.0.0.0
http.port: 9200
# ------------------------------------ Translog ----------------------------------
index.translog.flush_threshold_ops: 50000
# --------------------------------- Discovery ------------------------------------
discovery.zen.minimum_master_nodes: 1
discovery.zen.ping.timeout: 200s
discovery.zen.fd.ping_timeout: 200s
discovery.zen.fd.ping.interval: 30s
discovery.zen.fd.ping.retries: 6
discovery.zen.ping.unicast.hosts: ["10.10.1.60:9300","10.10.1.90:9300","10.10.1.244:9300",]
discovery.zen.ping.multicast.enabled: false
# --------------------------------- merge ------------------------------------------
indices.store.throttle.max_bytes_per_sec: 100mb
注: path.data、path.logs 这两个参数指定的路径,如果没有需要自己创建,还要赋予权限给elasticsearch用户。(后面的ES DataNode也同样)
4、安装head、kopf、bigdesk 开源插件
安装方法有两种 :
1、使用ES自带的命令plugin
# head
/usr/share/elasticsearch/bin/plugin install mobz/elasticsearch-head
# kopf
/usr/share/elasticsearch/bin/plugin install lmenezes/elasticsearch-kopf
# bigdesk
/usr/share/elasticsearch/bin/plugin install hlstudio/bigdesk 2、自行下载插件的源码包安装
我们通过plugin命令安装的插件,其实是安装到了这个路径:/usr/share/elasticsearch/plugins
而plugin install 命令后面跟的这一串 mobz/elasticsearch-head 其实是github上的一个地址。
前面加上github的官网地址就是 https://github.com/mobz/elasticsearch-head 可以复制到浏览器中打开,找到该插件的源码仓库。
现在知道了,想要找插件自己可以去github上搜一下出来一大堆。随便选一个然后取后面那串路径,用ES自带的命令安装。
如果安装失败了,那么就手动下载该插件的源码包。 解压后直接整个目录mv到 ES 的插件安装路径下。
也就是这里: /usr/share/elasticsearch/plugins/
那如何访问安装好的插件呢?
http://ES_server_ip:port/_plugin/plugin_name
Example:
http://127.0.0.1:9200/_plugin/head/
http://127.0.0.1:9200/_plugin/kopf/
这时,ES Master已经配置好了。
布置ES DataNode节点 10.10.1.60
安装和系统调优方法同上,插件不用安装,只是配置文件不同。
编写配置文件
# ---------------------------------- Cluster -----------------------------------
# Use a descriptive name for your cluster:
cluster.name: bigdata
# ------------------------------------ Node ------------------------------------
node.name: server2
node.master: false
node.data: true
# ----------------------------------- Index ------------------------------------
index.number_of_shards: 5
index.number_of_replicas: 0
index.refresh_interval: 120s
# ----------------------------------- Paths ------------------------------------
path.data: /home/elk/data,/disk2/elk/data2
path.logs: /var/log/elasticsearch/elasticsearch.log
# ----------------------------------- Memory -----------------------------------
bootstrap.mlockall: true
indices.fielddata.cache.size: 50mb
#------------------------------------ Network And HTTP --------------------------
network.host: 0.0.0.0
http.port: 9200
# ------------------------------------ Translog ----------------------------------
index.translog.flush_threshold_ops: 50000
# --------------------------------- Discovery ------------------------------------
discovery.zen.minimum_master_nodes: 1
discovery.zen.ping.timeout: 200s
discovery.zen.fd.ping_timeout: 200s
discovery.zen.fd.ping.interval: 30s
discovery.zen.fd.ping.retries: 6
discovery.zen.ping.unicast.hosts: ["10.10.1.244:9300",]
discovery.zen.ping.multicast.enabled: false
# --------------------------------- merge ------------------------------------------
indices.store.throttle.max_bytes_per_sec: 100mb
10.10.1.60 也准备好了。
布置另一台ES DataNode节点 10.10.1.90
编写配置文件
# ---------------------------------- Cluster -----------------------------------
# Use a descriptive name for your cluster:
cluster.name: bigdata
# ------------------------------------ Node ------------------------------------
node.name: server3
node.master: false
node.data: true
# ----------------------------------- Index ------------------------------------
index.number_of_shards: 5
index.number_of_replicas: 0
index.refresh_interval: 120s
# ----------------------------------- Paths ------------------------------------
path.data: /home/elk/single
path.logs: /var/log/elasticsearch/elasticsearch.log
# ----------------------------------- Memory -----------------------------------
bootstrap.mlockall: true
indices.fielddata.cache.size: 50mb
#------------------------------------ Network And HTTP --------------------------
network.host: 0.0.0.0
http.port: 9200
# ------------------------------------ Translog ----------------------------------
index.translog.flush_threshold_ops: 50000
# --------------------------------- Discovery ------------------------------------
discovery.zen.minimum_master_nodes: 1
discovery.zen.ping.timeout: 200s
discovery.zen.fd.ping_timeout: 200s
discovery.zen.fd.ping.interval: 30s
discovery.zen.fd.ping.retries: 6
discovery.zen.ping.unicast.hosts: ["10.10.1.244:9300",]
discovery.zen.ping.multicast.enabled: false
# --------------------------------- merge ------------------------------------------
indices.store.throttle.max_bytes_per_sec: 100mb
5、现在三台ES节点已经准备就绪,分别启动服务
# 10.10.1.244
/etc/init.d/elasticsearch start
# 10.10.1.60
/etc/init.d/elasticsearch start
# 10.10.1.90
/etc/init.d/elasticsearch start
6、访问head插件,查看集群状态
[url=s5.51cto.com/wyfs02/M00/88/A6/wKiom1f-AxDRvIMHAABrDZjJzqo236.png]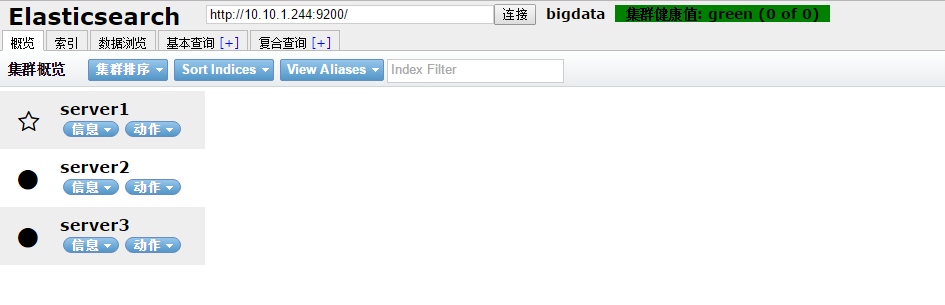 [/url] [/url]
此时 Elasticsearch 集群已经准备完成
二、配置位于架构图中第二层的ZooKeeper集群
配置 10.10.1.30 节点
1、安装,配置 zookeeper
zookeeper官网: http://zookeeper.apache.org/
# zookeeper 依赖 java,如果之前没安装过JDK,则需要安装.
rpm -ivh jdk-8u101-linux-x64.rpm
# 解压程序
tar xf zookeeper-3.4.9.tar.gz
编写配置文件
# conf/zoo.cfg
# The number of milliseconds of each tick
tickTime=2000
# The number of ticks that the initial
# synchronization phase can take
initLimit=10
# The number of ticks that can pass between
# sending a request and getting an acknowledgement
syncLimit=5
# the directory where the snapshot is stored.
# do not use /tmp for storage, /tmp here is just
# example sakes.
dataDir=/u01/zookeeper/zookeeper-3.4.9/data
# the port at which the clients will connect
clientPort=2181
# the maximum number of client connections.
# increase this if you need to handle more clients
#maxClientCnxns=60
server.11=10.10.1.30:2888:3888
server.12=10.10.1.31:2888:3888
server.13=10.10.1.32:2888:3888
# Be sure to read the maintenance section of the
# administrator guide before turning on autopurge.
#
# http://zookeeper.apache.org/doc/current/zookeeperAdmin.html#sc_maintenance
#
# The number of snapshots to retain in dataDir
# autopurge.snapRetainCount=3
# Purge task interval in hours
# Set to "0" to disable auto purge feature
# autopurge.purgeInterval=1
同步配置文件到其他两台节点
注: zookeeper 集群,每个节点的配置文件都是一样的。所以直接同步过去,不需要做任何修改。
不熟悉zookeeper的朋友,可以参考这里: http://tchuairen.blog.51cto.com/3848118/1859494
scp zoo.cfg 10.10.1.31:/usr/local/zookeeper-3.4.9/conf/
scp zoo.cfg 10.10.1.32:/usr/local/zookeeper-3.4.9/conf/
2、创建myid文件
# 10.10.1.30
echo 11 >/usr/local/zookeeper-3.4.9/data/myid
# 10.10.1.31
echo 12 >/usr/local/zookeeper-3.4.9/data/myid
# 10.10.1.32
echo 13 >/usr/local/zookeeper-3.4.9/data/myid
3、启动服务 & 查看节点状态
# 10.10.1.30
bin/zkServer.sh start
bin/zkServer.sh status
ZooKeeper JMX enabled by default
Using config: /usr/local/zookeeper/zookeeper-3.4.9/bin/../conf/zoo.cfg
Mode: leader
# 10.10.1.31
bin/zkServer.sh start
bin/zkServer.sh status
ZooKeeper JMX enabled by default
Using config: /usr/local/zookeeper/zookeeper-3.4.9/bin/../conf/zoo.cfg
Mode: follower
# 10.10.1.32
bin/zkServer.sh start
bin/zkServer.sh status
ZooKeeper JMX enabled by default
Using config: /usr/local/zookeeper/zookeeper-3.4.9/bin/../conf/zoo.cfg
Mode: follower
此时zookeeper集群配置完成
三、配置位于架构图中第二层的Kafka Broker集群
Kafka官网: http://kafka.apache.org/
不熟悉Kafka的朋友可以参考: http://tchuairen.blog.51cto.com/3848118/1855090
配置 10.10.1.30 节点
1、安装,配置 kafka
# 解压程序
tar xf kafka_2.11-0.10.0.1.tgz
编写配置文件
############################# Server Basics #############################
broker.id=1
############################# Socket Server Settings #############################
num.network.threads=3
# The number of threads doing disk I/O
num.io.threads=8
# The send buffer (SO_SNDBUF) used by the socket server
socket.send.buffer.bytes=102400
# The receive buffer (SO_RCVBUF) used by the socket server
socket.receive.buffer.bytes=102400
# The maximum size of a request that the socket server will accept (protection against OOM)
socket.request.max.bytes=104857600
############################# Log Basics #############################
log.dirs=/usr/local/kafka/kafka_2.11-0.10.0.1/data
num.partitions=6
num.recovery.threads.per.data.dir=1
############################# Log Flush Policy #############################
# The number of messages to accept before forcing a flush of data to disk
#log.flush.interval.messages=10000
# The maximum amount of time a message can sit in a log before we force a flush
#log.flush.interval.ms=1000
############################# Log Retention Policy #############################
log.retention.hours=60
log.segment.bytes=1073741824
log.retention.check.interval.ms=300000
############################# Zookeeper #############################
zookeeper.connect=10.10.1.30:2181,10.10.1.31:2181,10.10.1.32:2181
zookeeper.connection.timeout.ms=6000
注: 其他两个节点的配置文件也基本相同,只有一个参数需要修改 broker.id 。 它用于唯一标识节点,所以绝对不能相同,不然会节点冲突。
同步配置文件到其他两台节点
scp server.properties 10.10.1.31:/usr/local/kafka/kafka_2.11-0.10.0.1/config/
scp server.properties 10.10.1.32:/usr/local/kafka/kafka_2.11-0.10.0.1/config/
# 修改 broker.id
# 10.10.1.31
broker.id=2
# 10.10.1.32
broker.id=3
2、配置主机名对应IP的解析
vim /etc/hosts
10.10.1.30 server1
10.10.1.31 server2
10.10.1.32 server3
# 记得同步到其他两台节点
3、启动服务
bin/kafka-server-start.sh config/server.properties
# 其他两台节点启动方式相同
Kafka+ZooKeeper集群配置完成
四、配置位于架构图中第二层的Logstash服务
配置 10.10.1.30 节点
1、安装,配置 logstash
# 解压程序
tar xf logstash-2.3.2.tar.gz
配置 GeoLiteCity , 用于地图显示IP访问的城市
官网地址: http://dev.maxmind.com/geoip/legacy/geolite/
下载地址: http://geolite.maxmind.com/download/geoip/database/GeoLiteCity.dat.gz
解压
gunzip GeoLiteCity.dat.gz
编写配置文件
input {
beats {
port => 5044
codec => "json"
}
}
filter {
if [type] == "nginxacclog" {
geoip {
source => "clientip" # 与日志中访问地址的key要对应
target => "geoip"
database => "/usr/local/logstash/GeoLiteCity.dat"
add_field => [ "[geoip][coordinates]","%{[geoip][longitude]}" ]
add_field => [ "[geoip][coordinates]","%{[geoip][latitude]}" ]
}
mutate {
convert => [ "[geoip][coordinates]","float" ]
}
}
}
output {
kafka {
workers => 2
bootstrap_servers => "10.10.1.30:9092,10.10.1.31:9092,10.10.1.32:9092"
topic_id => "peiyinlog"
}
}
2、启动服务
/usr/local/logstash/bin/logstash agent -f logstash_in_kafka.conf &
10.10.1.31 节点的这块配置,与上述完全相同。(略)
位于第二层、数据处理层的 Logstash 配置完成
五、配置数据采集层,业务服务器+Filebeat
1、定制Nginx日志格式
log_format json '{"@timestamp":"$time_iso8601",'
'"slbip":"$remote_addr",'
'"clientip":"$http_x_forwarded_for",'
'"serverip":"$server_addr",'
'"size":$body_bytes_sent,'
'"responsetime":$request_time,'
'"domain":"$host",'
'"method":"$request_method",'
'"requesturi":"$request_uri",'
'"url":"$uri",'
'"appversion":"$HTTP_APP_VERSION",'
'"referer":"$http_referer",'
'"agent":"$http_user_agent",'
'"status":"$status",'
'"devicecode":"$HTTP_HA"}';
# 在虚拟主机配置中调用
access_log /alidata/log/nginx/access/access.log json;
2、安装 Filebeat
Filebeat 也是 Elasticsearch 公司的产品,在官网可以下载。
# rpm 包安装
yum install filebeat-1.2.3-x86_64.rpm -y
3、编写 Filebeat 配置文件
################### Filebeat Configuration Example #########################
############################# Filebeat ######################################
filebeat:
prospectors:
-
paths:
- /var/log/messages
input_type: log
document_type: messages
-
paths:
- /alidata/log/nginx/access/access.log
input_type: log
document_type: nginxacclog
-
paths:
- /alidata/www/logs/laravel.log
input_type: log
document_type: larlog
-
paths:
- /alidata/www/logs/500_error.log
input_type: log
document_type: peiyinlar_500error
-
paths:
- /alidata/www/logs/deposit.log
input_type: log
document_type: lar_deposit
-
paths:
- /alidata/www/logs/call_error.log
input_type: log
document_type: call_error
-
paths:
- /alidata/log/php/php-fpm.log.slow
input_type: log
document_type: phpslowlog
multiline:
pattern: '^[[:space:]]'
negate: true
match: after
registry_file: /var/lib/filebeat/registry
############################# Output ##########################################
output:
logstash:
hosts: ["10.26.95.215:5044"]
############################# Shipper #########################################
shipper:
name: "host_6"
############################# Logging #########################################
logging:
files:
rotateeverybytes: 10485760 # = 10MB
4、启动服务
/etc/init.d/filebeat start
数据采集层,Filebeat配置完成。
现在业务服务器上的日志数据已经在源源不断的写入缓存了。
六、配置位于架构图中的第三层,数据转发层
Logstash安装上面已经讲过(略)
编写Logstash配置文件
# kafka_to_es.conf
input{
kafka {
zk_connect => "10.10.1.30:2181,10.10.1.31:2181,10.10.1.32:2181"
group_id => "logstash"
topic_id => "peiyinlog"
reset_beginning => false
consumer_threads => 50
decorate_events => true
}
}
# 删除一些不需要的字段
filter {
if [type] == "nginxacclog" {
mutate {
remove_field => ["slbip","kafka","domain","serverip","url","@version","offset","input_type","count","source","fields","beat.hostname","host","tags"]
}
}
}
output {
if [type] == "nginxacclog" {
# stdout {codec => rubydebug }
elasticsearch {
hosts => ["10.10.1.90:9200","10.10.1.60:9200"]
index => "logstash-nginxacclog-%{+YYYY.MM.dd}"
manage_template => true
flush_size => 50000
idle_flush_time => 10
workers => 2
}
}
if [type] == "messages" {
elasticsearch {
hosts => ["10.10.1.90:9200","10.10.1.60:9200"]
index => "logstash-messages-%{+YYYY.MM.dd}"
manage_template => true
flush_size => 50000
idle_flush_time => 30
workers => 1
}
}
if [type] == "larlog" {
elasticsearch {
hosts => ["10.10.1.90:9200","10.10.1.60:9200"]
index => "logstash-larlog-%{+YYYY.MM.dd}"
manage_template => true
flush_size => 2000
idle_flush_time => 10
}
}
if [type] == "deposit" {
elasticsearch {
hosts => ["10.10.1.90:9200","10.10.1.60:9200"]
index => "logstash-deposit-%{+YYYY.MM.dd}"
manage_template => true
flush_size => 2000
idle_flush_time => 10
}
}
if [type] == "phpslowlog" {
elasticsearch {
hosts => ["10.10.1.90:9200","10.10.1.60:9200"]
index => "logstash-phpslowlog-%{+YYYY.MM.dd}"
manage_template => true
flush_size => 2000
idle_flush_time => 10
}
}
}
启动服务
/usr/local/logstash/bin/logstash agent -f kafka_to_es.conf &
数据转发层已经配置完成
这时数据已经陆陆续续的从kafka取出,转存到ES DataNode。
我们登陆到任意一台kafka主机,查看数据的缓存和消费情况
[url=s3.51cto.com/wyfs02/M02/88/A7/wKioL1f-8G3gYSE2AABXLzMqcf0058.png]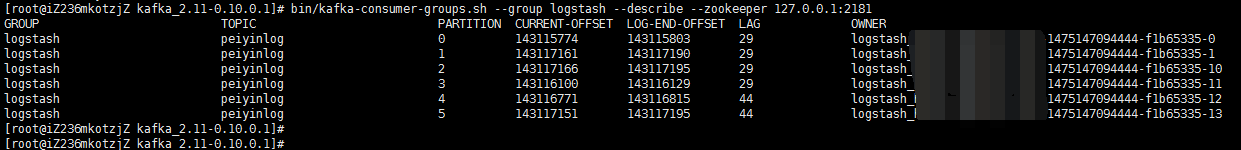 [/url] [/url]
七、修改ES的索引模版配置
为什么要做这一步呢? 因为logstash写入数据到ES时,会自动选用一个索引模版。 我们可以看一下
[url=s1.51cto.com/wyfs02/M02/88/A8/wKioL1f-85ngb4HBAABR4b08KRI422.png] [/url] [/url]
这个模版其实也挺好,不过有一个参数,我标记出来了。 "refresh_interval":"5s" 这个参数用于控制,索引的刷新频率。 索引的刷新频率越快,你搜索到的数据就实时。 这里是5秒。 一般我们日志场景不需要这么高的实时性。 可以适当降低该参数,提高ES 索引库的写入速度。
上传自定义模版
curl -XPUT http://10.10.1.244:9200/_template/logstash2 -d '
{
"order":1,
"template":"logstash-*",
"settings":{
"index":{
"refresh_interval":"120s"
}
},
"mappings":{
"_default_":{
"_all":{
"enabled":false
}
}
}
}'
由于这个自定义模版,我把优先级 order 定义的比logstash模版高,而模版的匹配规则又一样,所以这个自定义模版的配置会覆盖原logstash模版。
我这里只是简单描述。 如果要详细理解其中道理,请查看我的 ES 调优篇。
八、配置 Kibana 数据展示层
10.10.1.244 节点
Kibana是ELK套件中的一员,也属于elasticsearch 公司,在官网提供下载。
安装
tar xf kibana-4.5.3-linux-x64.tar.gz
# 很简单,只要解压就可以用。
修改配置文件
# vim kibana-4.5.3-linux-x64/config/kibana.yml
# Kibana is served by a back end server. This controls which port to use.
server.port: 5601
# The host to bind the server to.
server.host: "0.0.0.0"
# The Elasticsearch instance to use for all your queries.
elasticsearch.url: "
# 修改这三个参数就好了
启动服务
[url=s2.51cto.com/wyfs02/M00/88/AB/wKiom1f--1jjDIH4AACCZWwZlR0270.png]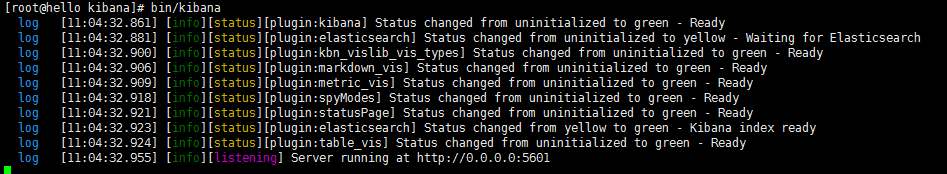 [/url] [/url]
打开浏览器访问: http://10.10.1.244:5601/
定制 Elasticsearch 索引的 Index pattern
默认情况下,Kibana认为你要访问的是通过Logstash导入Elasticsearch的数据,这时候你可以用默认的 logstash-* 作为你的 index pattern。 通配符(*)匹配索引名中任意字符任意个数。
选择一个包含了时间戳的索引字段(字段类型为 date 的字段),可以用来做基于时间的处理。Kibana 会读取索引的
映射,然后列出所有包含了时间戳的字段。如果你的索引没有基于时间的数据.
关闭 Index contains time-based events 参数。
如果一个新索引是定期生成,而且索引名中带有时间戳,选择 Use event times to create index names 选项,
然后再选择 Index pattern interval 。这可以提高搜索性能,Kibana 会至搜索你指定的时间范围内的索引。在你用 Logstash 输出数据给Elasticsearch 的情况下尤其有效。
由于我们的索引是用日期命名,按照每天分割的。 index pattern 如下
[url=s2.51cto.com/wyfs02/M00/88/AC/wKiom1f-_yTCvOe2AADRDyL4MEg193.png]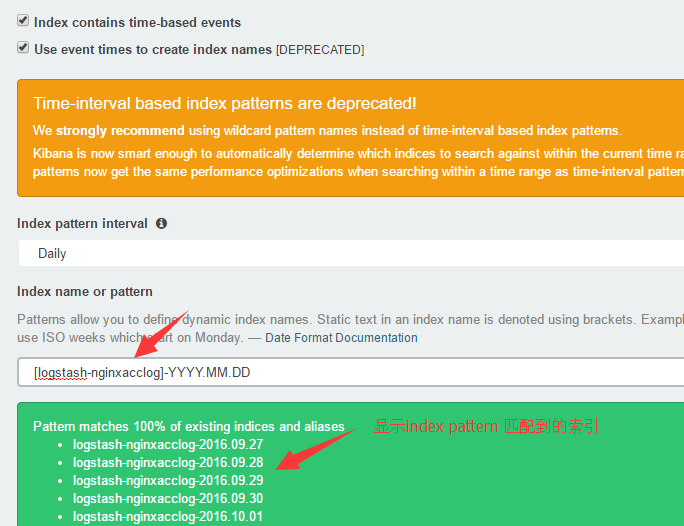 [/url] [/url]
数据展示
[url=s2.51cto.com/wyfs02/M02/88/AC/wKiom1f-_5uhQx3XAADGEwSe3Us023.png]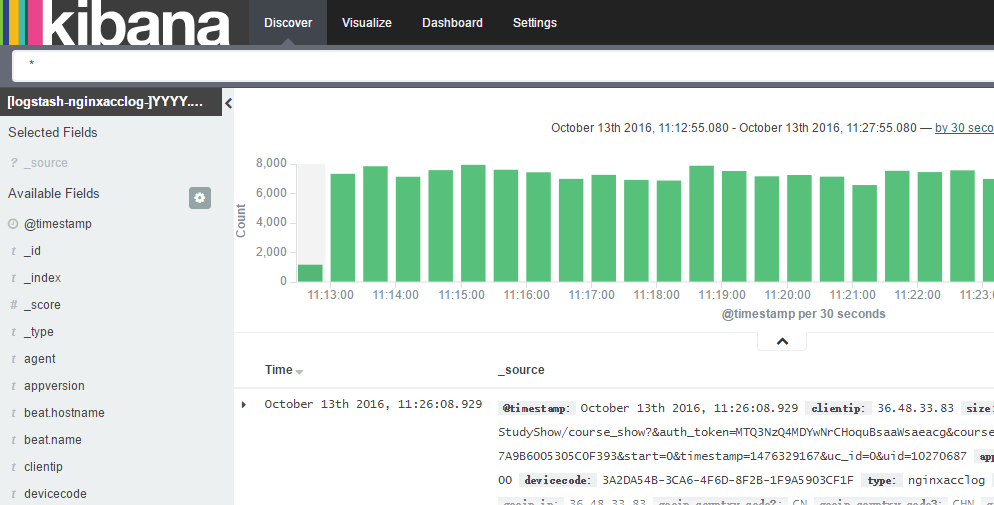 [/url] [/url]
完 工 !
----------------------------
原文链接:https://blog.51cto.com/tchuairen/1861167
程序猿的技术大观园:www.javathinker.net
|
|


 消息
消息 查看
查看 搜索
搜索 好友
好友 邮件
邮件 复制
复制 引用
引用